Excel Export Plus settings
The Excel Export Plus function enables different types of lists to be generated in Microsoft Excel format: material lists, cutting lists, and so on. There is one default report profile that you can use to generate a sample report, and from the generated report, you can access tools to create customized reports for different purposes.
Excel Export Plus is a separately licensed module that must be selected explicitly during installation.
Users must have Microsoft Excel with Visual Basic for Application (VBA) installed to use this function, and Excel macro security settings must permit macro execution. If eBrowser integration is to be used, its 32-bit version must be installed on the same computer as Plant Modeller, and an eBrowser model must be published from Plant Modeller.
For information on how to generate reports, see Excel Export Plus.
The administrative actions related to this tool are described below.
CADMATIC Menu in Microsoft Excel
In a Microsoft Excel file generated with Excel Export Plus, the Add-Ins tab has a CADMATIC Menu button that allows you to run various commands.
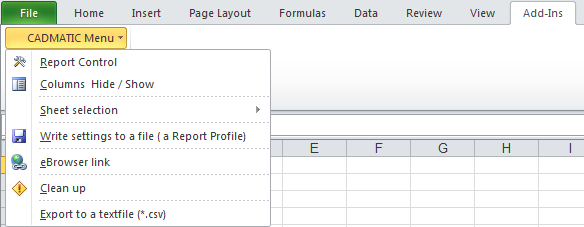
The commands are:
-
Report Control – Opens the Report Control dialog for defining how the report is generated. See CADMATIC Menu > Report Control.
-
Columns Hide / Show – Opens the Select Columns dialog where you can define what columns to show in the data sheets of the report.
-
Sheet selection – Lists the data sheets of the report. Select a sheet from the list to display that sheet. The same list can also be found from the TOTAL sheet of the report file.
-
Write settings to a file (a Report Profile) – Saves the report settings in a profile file (*.rpp). Create a separate profile for each different type of report that you want to generate.
The profile files are stored in the ExcelExportPlus subfolder of the $PMS_CONFDIR directory. Typically, this is <CADMATIC software>\<computer name>.stc\ExcelExportPlus\*.rpp, but it is also possible to store this folder under <ProjectName>\*.rpp. The Excel template is taken from <CADMATIC software>\pms<software version>\opt\pm\ExcelExportPlus\ExcelExportPlus_template.xlsm, or from the previously mentioned ExcelExportPlus directory.
-
eBrowser link – Opens a file browser for linking the report to an eBrowser model.
-
Clean up – This option deletes the internal database that the report file uses and removes the CADMATIC Menu button from the report. This action results in a standard Excel file that still contains the same data, but you will not be able to regenerate it with different settings.
-
Export to a textfile (*.csv) – Saves the report settings in a text file (*.csv). To do this, you must first define the export settings in Report Control > Settings > Export to CSV.
CADMATIC Menu > Report Control
Selecting CADMATIC Menu > Report Control in a report created with Excel Export Plus opens the Report Control dialog where you can customize the report, generate a new report with the current settings, and possibly save the settings in a new report profile.
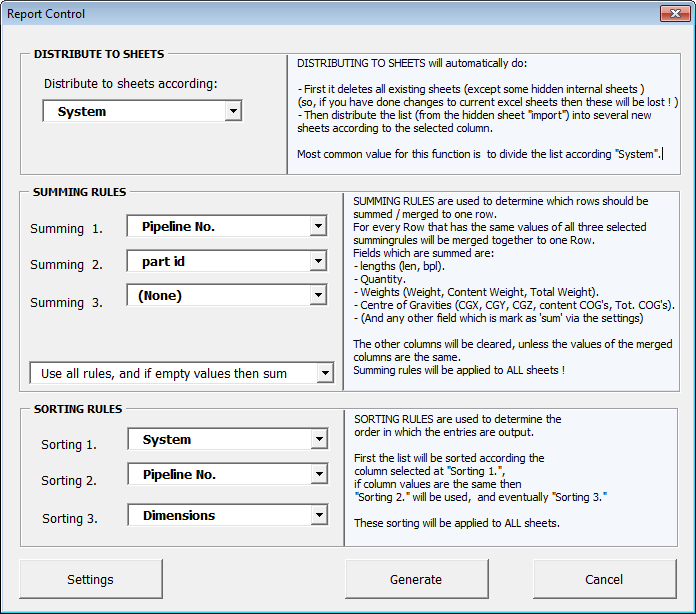
DISTRIBUTE TO SHEETS
In the DISTRIBUTE TO SHEETS pane, you can choose whether to list all objects in a single Excel sheet (option set to 'None') or distribute the objects to several sheets based on the values of a specific column. For instance, all objects that belong to the same system can be listed on separate sheets. If you change this setting and regenerate the report, all existing data sheets are deleted before new ones are added based on the selected categorization.
SUMMING RULES
The SUMMING RULES settings are used to determine which rows should be merged into a single row. For instance, all objects that have the same position ID or PartID can be merged into one row.
There are three criteria rows that define which columns to use for this. These are known as summing rules.
If you use two summing rules, for instance 'Pipeline No' and 'PartID', then all objects with the same 'Pipeline Number' AND the same 'part ID' will be merged into a single row.
In general, any rows that share the same values in all three selected summing rules will be merged into a single row.
When objects are merged into the same row, the quantity field is updated to reflect the total number of merged objects. For example, if three objects are merged into one row, the quantity is set to 3.
The following fields are summed when rows are merged into one:
- Length fields (len, bpl)
- Quantity
- Weight fields (Weight, Content Weight, Total Weight)
- Centers of Gravity (CGX, CGY, CGZ, content COGs, Tot. COGs)
- Any other field that is marked to be summed [Sum: yes] in the properties of the column (via Settings > Edit Row).
Columns that are not summed are cleared if the values of the merged rows differ. For instance, when two objects are merged based on description, but each object has a unique position ID, the merged row will not show any position ID value.
SORTING RULES
The SORTING RULES settings are used to determine the order in which the rows will be listed. First, the list is sorted based on the column selected in 'Sorting 1.'. If column values are the same, then 'Sorting 2.' is applied, followed by 'Sorting 3.' if needed.
CADMATIC Menu > Report Control > Settings
In the Report Control dialog, selecting Settings opens the Settings dialog.
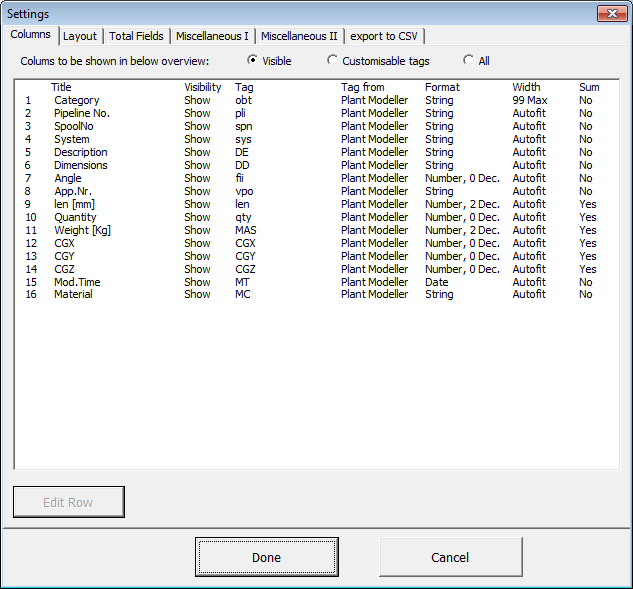
Columns tab
The Columns tab displays the available columns and their details. At the top, you can choose to display only the columns that are visible in the current report, only those with customizable tags, or all columns.
Columns with non-customizable tags contain information used elsewhere. For example, Weight is used to calculate Tot.Weight, so it cannot be customized.
To change the definition of a column, double-click the row or select it and click Edit Row. The Edit row dialog opens.
Edit row settings
-
Title – The description (name) of this column.
-
Visibility – This field is disabled. You can change visibility only using the Columns Show / Hide option in the CADMATIC Menu.
-
Tag – The tag to use.
 Show/hide details
In general, Outfitting objects have all kinds of additional data stored in the object. These data can be stored as attributes attached to the objects. For example, mass, name, system ID, and so on.
Each attribute is identified by its abbreviation, usually 2 or 3 characters long, and this abbreviation is called a tag. You can enter one or more tags in the TAG fields of this dialog. Multiple tags can be used, for instance, to collect different kinds of data and combine them into one field on the report.
You can enter text in the field by enclosing it within single quotes: 'some text'. For example, you can add the Dutch description (dud) and the standard description (DE) to the list with a slash between them:
TAGs: dud+'/'+DE
You can specify an alternative tag to be used when the normal tag has an empty value. For example, normally use the length tag, but if the object has no length, use quantity instead:
TAGs: len
Alternative Tag: qty
The data will be retrieved from Outfitting. Changes take effect only after saving the settings using the menu item Write settings to a file (Report Profile). When a new report is created from Plant Modeller using the changed profile, you will see the results of the changes in your report.
Most of the data can be retrieved from the Plant Modeller application. If you choose to use a tag retrieved from Piping Isometrics & Spools, bear in mind that report generation might be significantly slower, because the program has to check all objects in the isometric and spool drawings one by one.
-
Tag from – The application from where to get the tag.
Show/hide details
Tag information is normally extracted from Plant Modeller. It attempts to read tag data not only from the 3D object, but also from the referenced corporate catalog. COS attributes and properties can also be extracted, although this is not recommended as it slows down the COS server.
It is also possible to extract tags from project attributes or from isometric or spool drawings, via material files or header data. Retrieving tags from Piping Isometrics & Spools slows down report generation, as it takes more time to retrieve data from isometric and spool drawings.
At slave objects, retrieve tags from their master. A master object can refer to a slave object. A slave object is not a real 3D object, but only an object from the library. Depending on the context, tags for these slave objects should be retrieved from their master (such as pipeline information), or from the slave part itself (especially corporate catalog tags, like article code or material).
-
Format – Specifies the column format. If you set this to 'formula', you can use any formula supported by Excel. For example, you can use [R] to fill in the row number; to extract a value from a column, you can use the formula =A[R]. Other examples:
-
=A[R] & B[R] to combine text of column A and column B
-
=C[R] + D[R] to add the values of column C and column D
-
=IF(B[R]=C[R],"ok", "not ok")
-
="Project is: " & A$8 (value of some specific A8 field; notice the '$' character)
Note: When using operators such as IF in the formula, you must use the original (English) operators, not any localized versions.
-
-
Width – Column width.
-
Autofit – Allows Excel to adjust the column width based on the column's values.
-
Fixed – Applies a fixed width to the column. You can either type the value or click Width to copy the current width from the Excel sheet.
-
Min. and Max. – Similar to Autofit, but you can define the minimum or maximum width.
-
Layout tab
On the Layout tab, you can customize the layout of the report. Select a sheet from the list to specify its settings.
The Select Layout Sheet drop-down menu lists the available layouts. LAYOUT1, LAYOUT2, and LAYOUT3 are default, hidden layout sheets defined in the file ExcelExportPlus_template.xlsm. If the file contains any other sheets whose name starts with LAYOUT, they are listed in the drop-down menu. Accordingly, to create a custom report layout, you must first add a new sheet using a name such as LAYOUT4, design the header block in the sheet, and then you can adjust its other settings on this Layout tab.
Number of Rows and Columns on layout specifies the starting point of data rows below the header block. If the header block contains 16 rows of information, enter Rows: 17, Columns: 1 to specify that the actual list starts from row 17, column 1. The same can be achieved by leaving the Rows and Columns values to zero, and entering the word DATA in the specified cell of the template layout sheet.
In the Layout Sheet Settings pane, you can specify the following settings.
- Hide Titlerow – If selected, the system does not add a title row to the report file. Select this option if a title row is defined in the layout sheet.
- Retrieve Width of Columns from columns of layout sheet – If selected, column width is taken from the layout sheet.
- Fit width to one page (via scaling) – If selected, the system scales the report to fit on one page.
- Add row with Excel Autofilter – If selected, a filter row is added to the report.
In the Layout Header & Footer texts pane, you can specify the header and footer texts. You can use:
-
Free text
-
Any environment or project attribute, prefixed with the Dollar character: $PMS_PROJNAME.
-
Standard Excel definitions, such as:
- &B for Bold text
- &F for File name
- &D for Date
- &P for Page
Total Fields tab
On the Total Fields tab, you can specify the total values to be calculated and displayed in the report.
-
Add Total fields – If selected, the total value of Mass, Length, and Center of Gravity is calculated and displayed at the bottom of the respective columns. Additionally, you can select to include content weight in the calculation.
-
Add Summary Sheet – If selected, the total values of Mass, Length, and Center of Gravity is calculated and displayed on a separate sheet. Additionally, you can select to include content weight in the calculation.
-
Custom Total fields – To specify additional columns with numeric values for which a total value should be calculated and displayed in the report.
Miscellaneous I tab
On the Miscellaneous I tab, you can specify the following settings.
- Target Directory Reportfile – To specify the location where the report file is generated.
- Counter Column – To specify a column that should contain a running number.
- Lengths in Meters or Millimeters – By default lengths are expressed in millimeters. Select Unit in Meters to express lengths in meters instead.
Miscellaneous II tab
On the Miscellaneous II tab, you can specify the following settings.
- Gaskets – To include gaskets in the report. Note that this might cause the report to be generated more slowly.
- Include Slaveparts – To include slave parts in the report.
- Close Excel – If selected, the Excel file is automatically closed after generating it.
- Delete sum-file – If selected, after generating the report the system deletes the *.sum file that it used for creating the report.
- Add quantity – If selected, a quantity value is added to objects that do not have a quantity value by default (typically, that is because they are measured in lengths instead of quantities).
Export to CSV tab
On the Export to CSV tab, you can specify settings that affect the CSV export that you can perform from the CADMATIC Menu of the report file.
- Export to CSV-file – If selected, the report can also be generated into a text file. By default the separator character is semicolon, but you can specify a different separator character in the Separator sign field.
- Columns included in the CSV-file – Enter the columns to include in the CSV file, using the internal column names such as COL_SYS for system.
- CSV Export Directory – To specify the location where the report file is generated.
- Add Headerline to CSV-file – If selected, a header row is added to the CSV file.
- Skip double-quotes around values – If selected, values are not enclosed in double quotes.
- Enforce a Dot as Decimal Separator – If selected, the dot (period) character is used as decimal separator, and the regional settings that otherwise specify this character are ignored.
Tips and tricks
-
You can extract a COS attribute from the corporate catalog by adding "cc_" in front of the tag.
-
When retrieving an attribute containing a COS ID (for instance, cmd), you can get the description of the COS object instead of its COS ID by adding "des_" in front of the tag: des_cmd.
-
When retrieving a dimension attribute, specify the Dim Name from the Dimension Table instead of a tag in the Tag field. For example, L1 or DN or Width.
-
Node information can be extracted via NOD<Node ID><tag>. Examples:
-
NOD1x – To get the X-coordinate [x] of node 1.
-
NOD2ft1 – To get the face description [ft1] of node 2.
-
-
Plant Modeller drawing information can be shown in the report via the following tags.
-
'drwv' – To present in which drawings and drawing views an object is shown. If an object is labeled in that view, then the text "(LABELED)" is added to it. <drawingname1> [<view1>, <view2>], <drawingname2> [<view3>, <view4>(LABELED)]
-
'drwl' – To present the label names in case the object is labeled in the views.
Note: Generating reports with drawing information is slower than generating regular reports, especially during the first run, as the drawing information needs to be cached and updated. However, subsequent report generations should be somewhat faster due to cached data.
-
-
Information can be extracted to custom layout sheets.
-
Sheets can use environment variables via a string starting with the dollar sign $. Example:
-
$USERNAME – To get the user name.
-
-
Sheets can use project attributes via a string starting with $PROJTAG. Example:
-
$PROJTAG_.dG – To get the project description [.dG].
-
Note: After adding these to the Excel template, write the settings file (*.rpp) before generating the report.
-
-
There can be only three summing rules and three sorting rules. This is because Excel can internally sort by only three criteria at a time. However, you can use any number of summing rules by combining columns. For instance, you can create a dummy column that combines the contents of three other columns, and then use this dummy column in the summing rule. This way, you use only one summing rule, leaving the other two available.
-
There is a predefined column called 'SpoolObject', which can be used in summing rules. It not only checks the spool numbers, but also groups objects that are not yet spool-numbered. When generating the report, it uses the spool break rules to assign a temporary spool number, which is then used in this column.
-
The 'SpoolObject' column contains a unique value for every object that belongs to the same spool (or will belong to it once the spool is numbered). The actual values in this column may not be meaningful on their own, but the column is useful in summing rules, allowing you to identify which spools are ready and which are not.
-
Some pipe parts have information about the fabrication method (mth), such as bends or tees. In the report, you can list the number of bends ($B) or tees ($T) found in the piperun. This can be done by using the attribute abbreviations: 'bends' or 'tees'.
-
You can use custom attributes:
- rg0 – The status of the iso(!) doc: "Iso Needs Update" / "Iso is UpToDate".
- rg1 – To extract the modification time of the spool drawing.
- rg2 – To extract the IsoDocname property COS_PROPERTY_CREATED_BY.
-
Hole request objects (RFH) can extract various tags.
-
Tags starting with 'TAR' extract the tag from the target object (hull plate).
-
Tags starting with 'TRI' extract the tag from the trigger object (penetration, or equipment if the request is created via 'insert opening').
-
Tag 'HResp_MT' gets the modification time of (the latest response object of) the RFH object.
-
-
Tags starting with 'X' allow extracting COS attributes from (classic) spool or isometric drawings.
-
Tags starting with 'CodEnumStr_' get the description of a coded-enumerated attribute instead of its numeric value.
-
Named coordinates can be displayed for the local origin (lox, loy, loz) using the tags 'xre', 'yre', and 'zre' (where 're' is short for 'reference'). This allows you to present values such as Fr10+50 instead of absolute coordinates.